 | |||
SGR-Displacement Plots The SGR, and seal behavior, changes as throw increases. If a point on the fault moves past progressively more and more shale, the SGR will decrease with increasing throw. If that point on the fault moves past progressively more and more sand, the SGR will increase with increasing throw. The pattern of SGR with increasing displacement may be quite complex. It simply mirrors the stratigraphy moving past the fault.
| his is a sample
The SGR is calculated from the sand/shale ratio of the section moving past a point on the fault (SGR) | ||
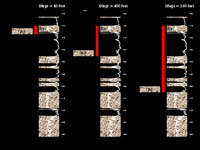
At a throw of 100 ft, the SGR begins to increase as a sand section begins to move past the fault. The SGR reaches a maximum at approximately 450 ft. The SGR again begins to decrease as a more shale-prone section moves past the fault. Seal risk is changing as both the displacement and the stratigraphy change. A fault may leak at a displacement of 10 ft, seal at a displacement of 100, leak at a displacement of 450, and seal again at a displacement of 600 ft. A fault will change seal behavior both along strike and dip. A fault will change seal behavior during fault growth.
| This SGR-Displacement plot shows the change in SGR as the fault throw increases from 0-1000 ft for the well previously shown (above right). As the throw increases from zero, the SGR rapidly decreases as a thick shale section moves past the fault. The SGR reaches a minimum at a throw of approximately 100 ft.
|
| For further information or to schedule a SEALS course CONTACT
|