 | |||
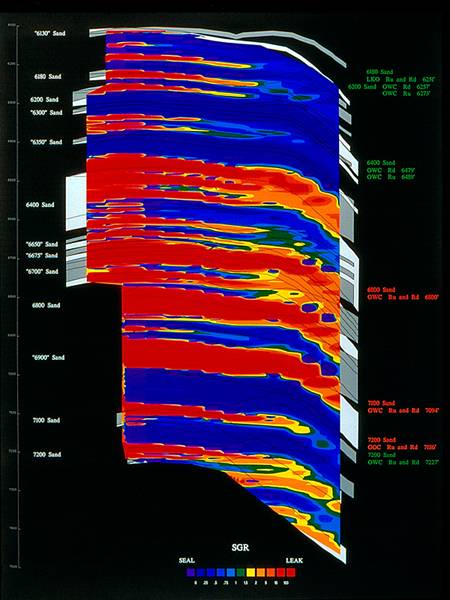
SGR Maps Quantitative fault seal analysis is routinely done for the entire fault plane and the SGR mapped over the surface. The following example, from Romere Pass field, Louisiana Gulf Coast, shows the variation in seal behavior over the fault plane. High SGR values (sand-prone gouge) are shown in reds/oranges. Low SGR values (shale-prone gouge) are shown in blues/purples.Areas of the fault plane with high SGR's leak. Areas of the fault plane with low SGR's seal. The sealing behavior of the fault is highly varied. This FPP shows approximately 1400 feet of stratigraphic section along Fault W. The figure on the right shows the same fault plane except that SGR values are contoured and plotted only on the areas of sand/sand juxtaposition. | his is a sample |
| |
SGR Map of Fault W
| |||
|
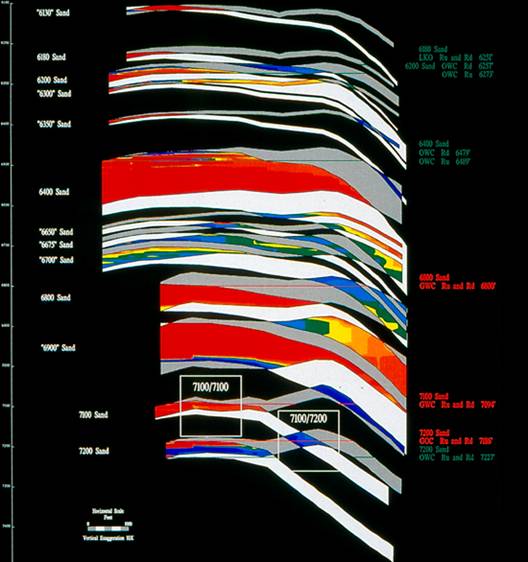
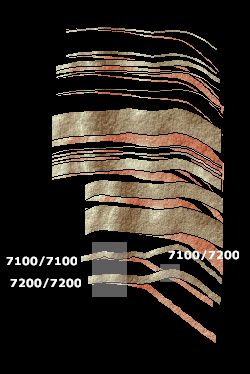
| This is the same fault plane profile examined earlier (left). There are high SGR's over the cross leaking juxtapositions 7100/7100 and 7200/7200; there are low SGR's over the cross sealing juxtaposition (7100/7200.
| In calculating the SGR, each well has been "rubber-banded" so that the stratigraphy in the well matches the bed cutoffs on the fault plane profile. The SGR is calculated for the actual stratigraphic thickness that has moved along the fault plane, not the thickness in the well. Simple calculation of SGR using the well directly, without this correction, will give erroneous results. | |
| For further information or to schedule a SEALS course CONTACT
|